Averages Examination

Examination questions involving using averages to find the answer.

When we describe data at GCSE, we are basically after two things: the location and the spread.
The location of data is given as the average. More often than not, the average we want to use is the median because it is not as vulnerable to outliers (which are data points that do not follow the normal pattern).
The spread is how widely the data is distributed. This is measured in one of two ways. The range is simply the maximum value of data take the minimum value of data. This is affected by outliers. A better measure would be the inter-quartile range. This is the range of the middle band of data between the upper and lower quartiles.
Examination questions involving using averages to find the answer.

Looking at how to calculate the arithmetic mean, median and the modal averages of a small set of data.
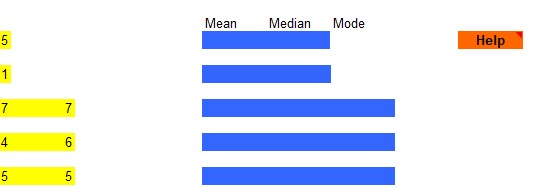
Work out different averages and the spreadsheet will tell you if you have the answers correct or not.

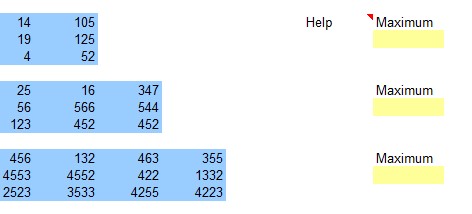
Work out different averages and the range and the spreadsheet will tell you if you have the answers correct or not.
Work out different averages and the spreadsheet will tell you if you have the answers correct or not.

KS2 exercises on interpreting graphs and bar charts.
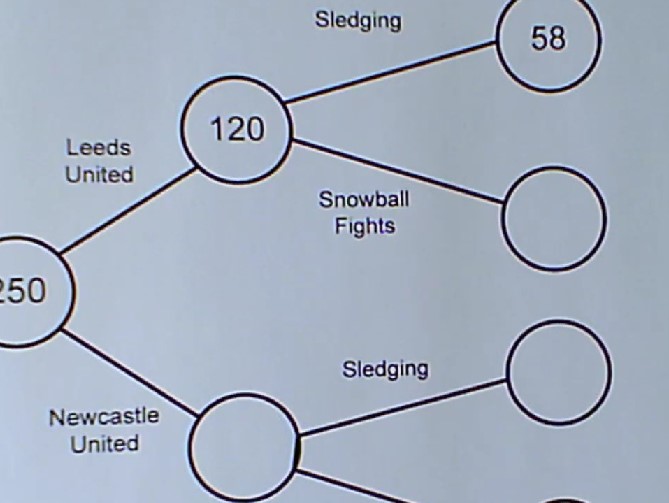
Video on completing frequency trees.

Answer questions about numbers on a number grid including things like averages, maximum and minimum etc.

Answer questions comparing one pie chart to another.